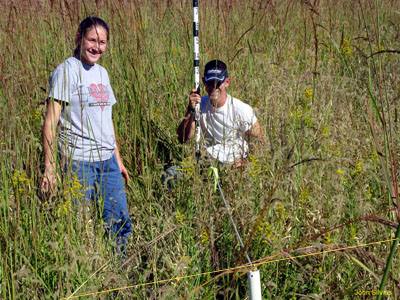
Figure 1. Amanda and Jason work at a sample point in a
"disturbed plot."
Short pole (foreground) marks sample
point
on N-S transect
(gold string). Quadrat is placed 1.75 m
E of
sample point at yellow
marker flag on perpendicular gray line.
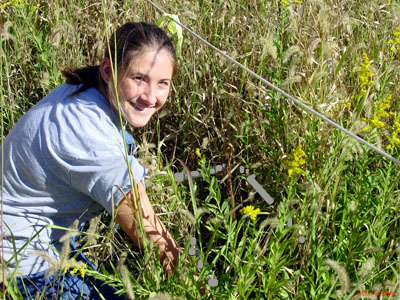
Figure 2. Close-up of quadrat placement as described in legend
of
Photo 1.
Cover of each species is estimated using Daubenmire's
approach based on visual markings on the quadrat frame.
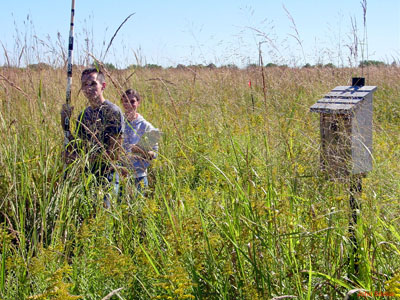
Figure 3. Mike and Lacy are partly obscured by Tall Goldenrod
(foreground), Big Bluestem, Indian Grass, and Switchgrass in
Plot #3, a "Control" Plot.
Prairie Restoration Project - Cedarville University
Summer, 2005 (1st Yr.) Response to Soil Disturbance
I. How Did Disturbance Affect the Dominants?
Sampling Plant Populations:
Having introduced the disturbance treatments in Spring, 2005 as described in Decreasing the Dominants by Soil Disturbance, we were eager to study the effect of disturbance on relative abundance of plant species in the Fall.
In September of 2005, students in BIO 3800 Biological Research designed and conducted a plant species survey involving 123 quadrat samples (0.25-m 2 ) each centered 1.75 m E (east) of a randomly chosen sample point on a N-S line transect. We visually estimated cover* within each quadrat and recorded vegetation height at 3 locations each 3.5 m from the sample point, and in directions of NE, E, and SE of the sample point. We assigned a cover value of 1.1 to designate each species not present in the quadrat but present within the semicircular area (19 m2 ) defined by the 3.5-m radius noted above. Frequency is an estimate of distribution and represents the total number of sample points in which a given species is present, regardless of its cover.
Six transects were completed, two transects in each of the 3 "Control" plots and two in each of the 3 "Disturbed" plots. Each transect was started from a randomly selected point of origin along the plot's northern boundary and was positioned in a N-S compass direction (Figure 1).
Results:
During the summer growing season, it became evident that our disturbance treatment was causing visible differences in plant species abundance and the resultant structure of the plant community. Disturbance decreased the relative abundance or plant cover of Indian Grass and Tall Goldenrod as is suggested in Figures 1 and 2. Note the lower density of these dominants in Figures 1 and 2 compared to Figure 3, taken in Plot #3, a "Control" plot.
In many instances in "Control" plots, the dominant Indian Grass and Tall Goldenrod did not share the same spatial distribution, but instead exercised dominance in separate areas, thus contributing to a "patchiness" marked by an increased vegetation height diversity (Figure 4).
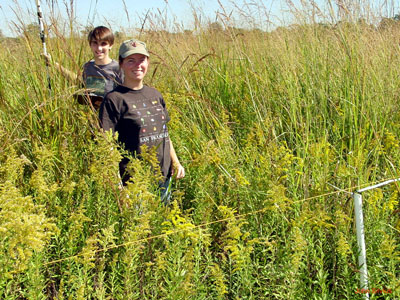
Figure 4. Tall Goldenrod dominates the area in front of Trevor
and Mallery; whereas, Indian Grass, Big Bluestem, and Switchgrass
dominate in the area behind them in this "Control" plot.
Question to Consider:
If soil disturbance did in fact reduce the relative abundance of Tall Goldenrod and Indian Grass, then what species were able to take advantage of the reduced dominance and competition from these perennials?
To answer this question, turn to the next page, "Who Benefits from Disturbance?"
*Cover refers to the actual area or proportion of area of the ground surface that is shaded or otherwise occupied by a species, here a plant species. As such cover is a handy estimate of population size or abundance of each species when used in a random quadrat sampling experiment.