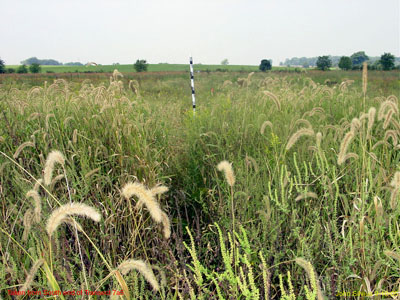
Figure 1. One of the most extreme responses to disturbance is shown here within Plot #7. Notice the abundance of Tall Foxtail (Setaria faberii) with its drooping brown spikes; and, Common Ragweed (Ambrosia artimisiifolia) with its slender, erect, green flower spikes..
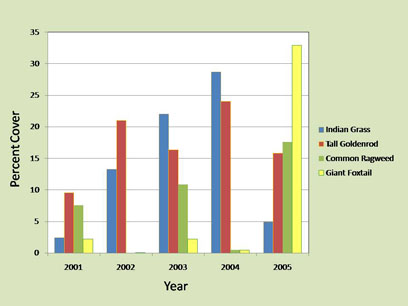
Figure 2. Percent cover of four dominant plant species during 2001-2004 in which fire was the principal disturbance (Spring, 2001 and 2003). Cover values for 2005 represent response to both the fire and disturbance in Spring, 2005. See Table 1 and Figure 3 for comparative cover values of both “control” and “disturbed” plots. From Joswig, et al. (2006) Reference below.
Questions to Consider:
1. How do annual plants such as Giant Foxtail and herbaceous perennial plants such as Indian Grass differ in how they become established in a given spatial location?
2. What is necessary for an annual plant population to remain in a given location? How do herbaceous perennials maintain their presence?
3. From your understanding of the difference between annuals and herbaceous perennials, explain any apparent trends in percent cover for annual plants during the period, 2001 to 2004 (Figure 2), and then following fire + disturbance , in 2005.
Answer this question for herbaceous perennials.
4. Does fire alone favor annual species such as Common Ragweed and Giant Foxtail? Support your answer from the data.
5. How is frequency computed in a sampling experiment (Table 1)? How is frequency an indication of the distribution of a population?
6. Referring to Table 1 and your answer to Question 5., how did soil disturbance affect the distribution of Indian Grass? Tall Goldenrod? Considering the manner in which these species maintain and expand their abundance in a given area (see Questions 1. and 2.), use the difference in frequency of the two species in the disturbed plots to predict which population will more quickly regain the percent cover (abundance) lost by disturbance.
7. Did the disturbance and seeding treatment increase total species richness (Table 2)? Did it increase "Per-Sample Species Richness?" How can these apparent contradictions be reconciled?
8. From the considerations that have arisen from the data and the questions above, how what predictions can you make about future trends in species abundance, distribution, and richness?
Where to from here?
The next step for the Working Group of 2005 was to prepare and present the results at a scientific meeting. See "Presenting the Results"
References:
Andreas, Barbara K., John J. Mack, and James S. McCormac. 2004. Floristic Quality Assessment Index (FQAI) for Vascular Plants and Mosses for the State of Ohio. Ohio Environmental Protection Agency, Division of Surface Water, Wetland Ecology Group, Columbus, Ohio. 219 p
Joswig, A.A., L.L. Sposato, J.C. Stephens, M.A. Waters, and J.E. Silvius. 2006. Enhancement of Plant Biodiversity During the Early Stages of a Prairie Restoration Effort. Poster Presentation, 61st Annual Meeting of the American Scientific Affiliation, Calvin College, Grand Rapids, MI.
Prairie Restoration Project - Cedarville University
Summer, 2005 (1st Yr.) Response to Soil Disturbance
II. Who Benefits from Disturbance?
Invasion by the Annuals
Who Benefits? :
Having observed that disturbance decreased the dominant species, particularly Indian Grass and Tall Goldenrod, we should ask "who would benefit from the space and resources provided when these dominants were uprooted by the chisel plowing?" The appearance of the disturbed plots (Figure 1) are consistent with the quantitative data (below).
The observable trend toward a decrease in relative abundance of Indian Grass and Tall Goldenrod was accompanied by an increase in abundance of Tall Foxtail (Setaria
faberii) and Common Ragweed
(Ambrosia artimisiifolia) (Figure 1). Less extreme invasions by these two species are more typical of the disturbed plots as is evident on the previous page in Figures 1 and 2).
Quantitative Results:
Although the effects of disturbance are most obvious among the "dominant players" of the prairie restoration(Figure 2), there are many other changes resulting from this treatment which become obvious when we study the numerical data (Table 1). Rather than simply describe and discuss these responses, allow us to present some questions for your consideration. We do this because students (and other visitors to this page) can learn much by thinking through the data sets in light of what you have learned or are learning in biology and ecology.
Table 1. Percent Cover, Frequency, and Coefficient of Conservatism* of Twenty Major Plant Species in Control and Disturbed Plots at the Cedarville University Prairie Restoration Site.
Disturbance of the soil stimulated a population explosion of Common Ragweed and Giant Foxtail from relatively low percent cover values of 5.8% and 0.5% respectively, to 17.6% and 32.9%, respectively. From Joswig, et al. (2006)
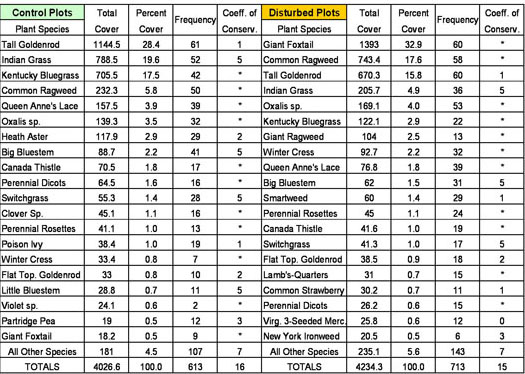
Figure 3. Changes in relative abundance of four dominant plant species in response to fire and soil disturbance in Spring, 2005, based on estimates of percent cover at the Cedarville U. Prairie Restoration Site. From Joswig, et al. 2006
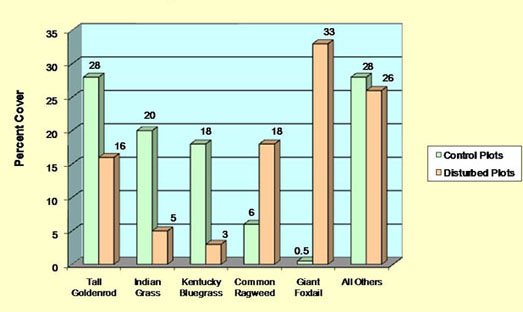
Table 2. Total Species Richness, Number of Conservative Species*, and Mean Per-Sample Species Richness for the Cedarville U. Prairie Restoration Site. Data were analyzed by Mann-Whitney Joswig, et al. 2006.
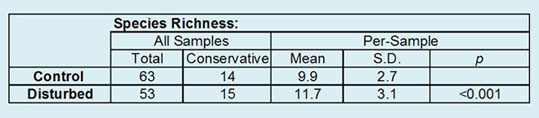
*Conservative Species - are species that have been consistently associated with high quality habitats as reflected in the Floristic Quality Index score assigned to the species. See Andreas, B.K. et al. 2004.